Next: 6 Diverse visualizations Up: 5 Visualization of surfaces Prev: 5.3 Utilization of VIS3XX Contents
![]()
![]()
![]()
![]()
![]()
![]()
![]()
![]()
Next: 6 Diverse visualizations
Up: 5 Visualization of surfaces
Prev: 5.3 Utilization of VIS3XX
Contents
The admissible data structures for a mesh consisting of triangles are
the AM(![]() The name of the author, A. Marrocco.) or NOPO data structures.
The name of the author, A. Marrocco.) or NOPO data structures.
The AM data structure is composed of 2 records (binary):
where N is the number of nodes in the mesh and NT is the number of triangles. NU is the array containing the vertex numbers and C is the array containing the nodal coordinates. JND is an array containing the sub-domain number of each element.
The NOPO data structure must be 2D and composed of P1 triangles only.
Several possibilities are offered as far as the results of the computation defined on the mesh are concerned:
(U and V may represent a solution vector, C is the array containing the nodal coordinates and X is a real scalar)
The (binary) file is composed of a set of records, each of length NX*NY and corresponds to array T(NX,NY).
The program will inquire what the record number is. NX and NY must be the same for the different records and must also be compatible with those defined (further on) with command MAILLE-XY.
The main commands correspond to BORNES-XY, MAILLE-XY and GRAD-ECH-XYZ.
This command is used to define a rectangular window in the (X,Y) plane, which serves as the domain in which function F(X,Y) is defined.
The input parameters are: XMIN, XMAX, YMIN and YMAX, the window extremities.
The initial values are, respectively, 0, 1 , 0 and 1.
For the case where the module is used to interpret the finite element results, we choose the domain bounds as XMIN, XMAX, YMIN and YMAX.
To define a grid in the window defined by XMIN, XMAX, YMIN and YMAX.
The input parameters are:
To choose the representation scale, linear or logarithmic, in the z-direction only. The initial choice corresponds to a linear scale.
Initially, there is an automatic scaling of the three-dimensional object to be represented (this can be prevented!).
The commands available at this level are: OBS, DIM, MODE, AXES, LEGEND and (return).
The "return" key is used to exit from the current subroutine and execute the plot.
The signification of the above commands is now given:
Positioning of the observer in spherical coordinates and observation angle. The input parameters are:
 the angle with respect with the OX axis (in degrees)
 the angle with respect to the XOY plane (in degrees) (elevation)
The initial values of the parameters are:  ,
,  and vis 2.
The observer always views the center of the box defined by XMIN, XMAX, YMIN, YMAX, ZMIN and ZMAX and his/her distance is calculated automatically such that the entire object is in view.
To define or modify the size (in cm.) of the plot.
The input parameters are: X1, X2, Y1 and Y2.
The initial values depend on the terminal used and correspond to the maximum size usable.
The surface display mode. There are several possibilities:
In the present case, this is also the domain displayed.
For MODE = 1 the surface is represented using lines.
For MODE = 2 the surface is represented using a grid.
In the present case, the displayed domain can be different to the definition domain as supplementary constraints can be imposed by the relations:
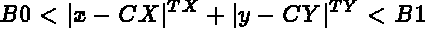
The user has the choice of parameters CX, CY, B0, B1, TX and TY, respectively
initialized to the values: 0, 0, 0, 1, 1 and 1.
For MODE = 3 the surface is represented using lines.
For MODE = 4 the surface is represented using a grid.
In the present case, the displayed domain can be different to the definition domain as supplementary constraints can be imposed by the relations:

The user has the choice of parameters C
CX, CY, B0, B1, TX, TY, AX and AY, respectively
initialized to the values: 0, 0, 0, 1, 1, 1, 1 and 1.
For MODE = 5 the surface is represented using lines.
For MODE = 6 the surface is represented using a grid.
In the present case, the displayed domain can be different to the definition domain as supplementary constraints can be imposed by the relations:
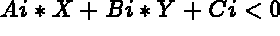
Linear constraints defining half-planes. The user can have up to 10 relations of this type.
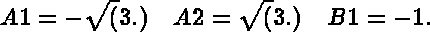
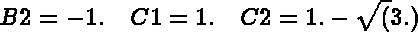
The initial values are 2 linear relations and the parameter values given below:
For MODE = 5 the surface is represented using lines.
For MODE = 6 the surface is represented using a grid.
This part corresponds to the axes. Plots of graded and referenced axes.
Output in space (3D) is obtained by transformation of a reference axis described on the (0,0),(1,0) segment of the XOY plane. The different parameters defining the axis are modified dynamically via a menu indicating the different options available.
Thus, when using keyword (or command) AXES, the following will appear on the screen:
|-------------------------------------------------------------------|
| ACTUELLEMENT on trace  N axes                                     |
|  aspect , mod_const , leg_axes , nb_axes , edit_contr , (return)  |
|-------------------------------------------------------------------|
N indicates the number of axes that we want to plot (this value is initialized to 0, (no plot)).
The line underneath indicates the different commands available. Only the first character of the command --- UPPERCASE (or lowercase depending on the implementation) --- is taken into account as response; this character can be replaced by the position number of the command: 1 for ASPECT, 2 for MOD_CONST, etc.
A legend (5 lines maximum) can be defined on the plot using this command. The user can also if necessary specify the placement, the character size and the thickness of the plotlines.
This section once again considers the definition of the axes and gives the different commands mentioned above in detail.
Different manners of generating the "reference-box" (parallelopiped), containing the object to be visualized, are possible.
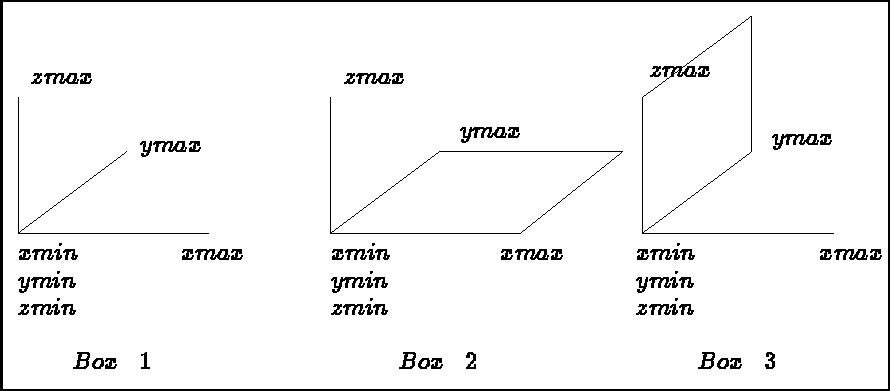
Figure 5.1: Reference-box 1, 2 and 3
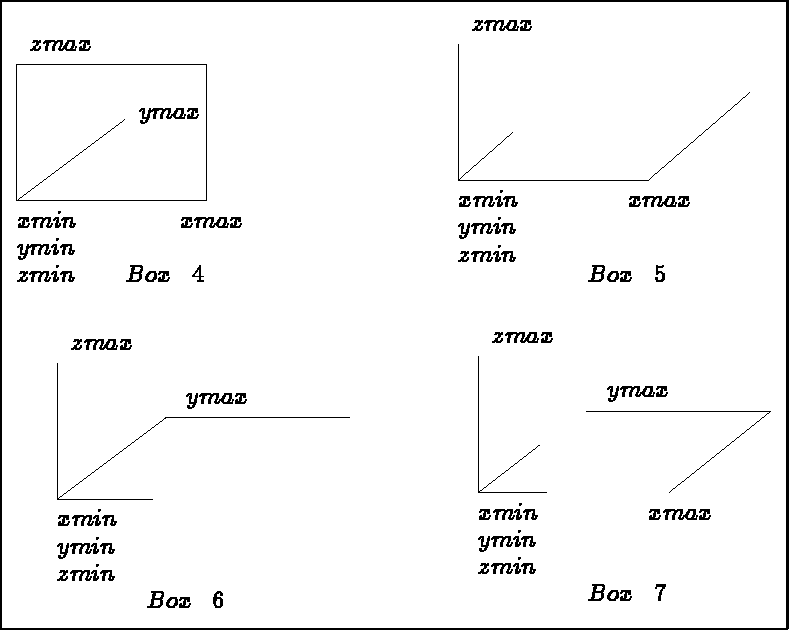
Figure 5.2: Reference-box 4, 5, 6 and 7
The different reference-boxes are shown in figures 5.1 and 5.2 for cases 1 to 7. Reference-box number 0 is the one where we visualize nothing, whereas a reference-box with a negative number corresponds to a complete parallelopiped.
Note that reference-box 2 is the default value.
The user then inputs the color of the reference-box lines (and graduations), i.e. the density of the red R (0,1), the density of the green V (0,1) and the density of the blue B (0,1). It is possible to perform modifications.
Definition and construction mode for axes (graduations):
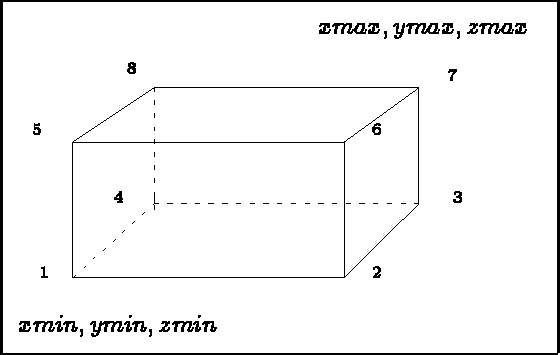
Figure 5.3: Numbers of the points in the cube
The values of the extremities are the values to be assigned, for example for axis 1-2: XMIN, XMAX (If we decide to plot axis 1-7, diagonal, the corresponding values must be entered)
 linear);
By default, the graduation scale is linear. If the log scale is chosen, the object must be defined and described using the same scale. There is thus a risk of encountering compatibity problems.
 1 or 2): subdivision into NGRAD referenced intervals,
each interval being subdivided into NSUB
sub-intervals.
1 or 2): subdivision into NGRAD referenced intervals,
each interval being subdivided into NSUB
sub-intervals.
 0: FORTRAN format F with NF digits after the decimal point
Thick plot lines possible (value input in mm.).
The default size of the characters with respect to the reference axis is
 units and the size of the dashes is 0.05.
Parameters 10, 11 and 12 are used to modify the relative value:
Value > 1: enlargement, or
Value < 1: reduction.
(13, 14 and 15 are linked to the generation mode of the graduations in 7).
The user must then input the legend corresponding to the axis, specify if he/she would like to frame the legend, as well as specify its position (8 positions are possible, see figure 5.4).
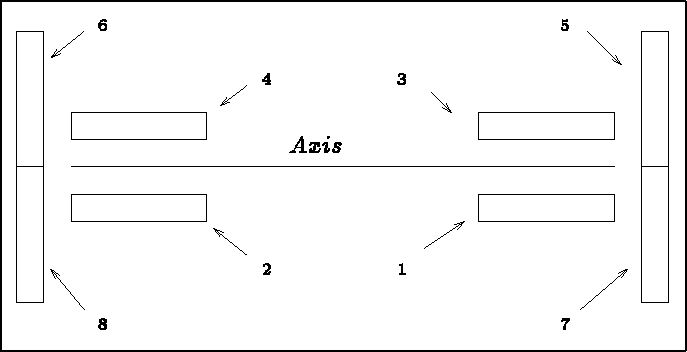
Figure 5.4: Positioning of legends on the axes
Finally, the user need to specify the vector which, with the axis, defines the printing plane of the graduations, values and legends of the axes.
Two examples are shown below:
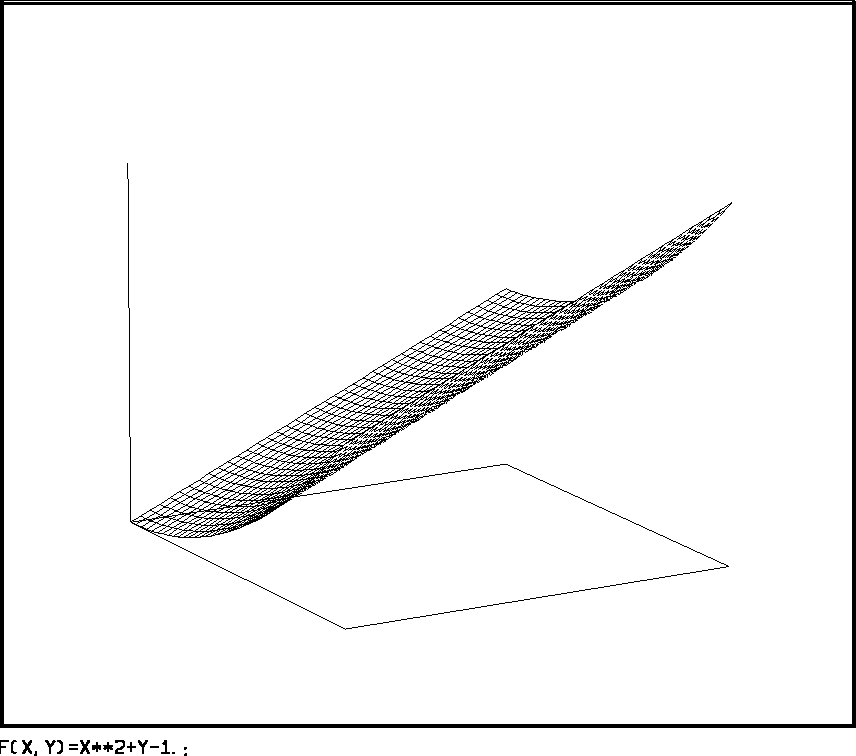
Figure 5.5: Example VIS3XX: manual definition
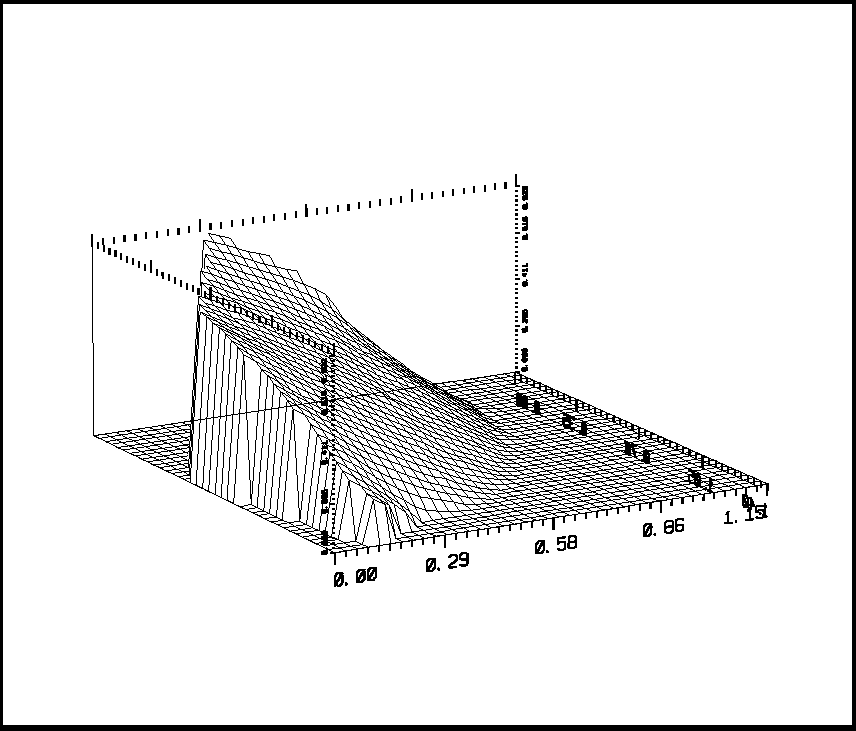
Figure 5.6: Example VIS3XX: NOPO and B