![]()
DynPeak has been developped within the Scilab environment.
The Scilab version of Dynpeak has been published under the Scilab Atoms system ; it can be downloaded from http://atoms.scilab.org/toolboxes/Dynpeak or loaded via the Atoms manager available from the main Scilab toolbar (in the Data Analysis and Statistics folder).
To contact the authors
The endocrine control of the reproductive function is often studied from the analysis of luteinizing hormone (LH) pulsatile
secretion by the pituitary gland. Whereas measurements in the cavernous sinus cumulate anatomical and technical difficulties,
LH levels can be easily assessed from jugular blood. However, plasma levels result from a convolution process due to clearance
effects when LH enters the general circulation. Simultaneous measurements comparing LH levels in the cavernous sinus and jugular
blood have revealed clear differences in the pulse shape, the amplitude and the baseline. Besides, experimental sampling occurs
at a relatively low frequency (typically every 10 min) with respect to LH highest frequency release (one pulse per hour) and the
resulting LH measurements are noised by both experimental and assay errors. As a result, the pattern of plasma LH may be not so
clearly pulsatile. Yet, reliable information on the InterPulse Intervals (IPI) is a prerequisite to study precisely the steroid
feedback exerted on the pituitary level. Hence, there is a real need for robust IPI detection algorithms.
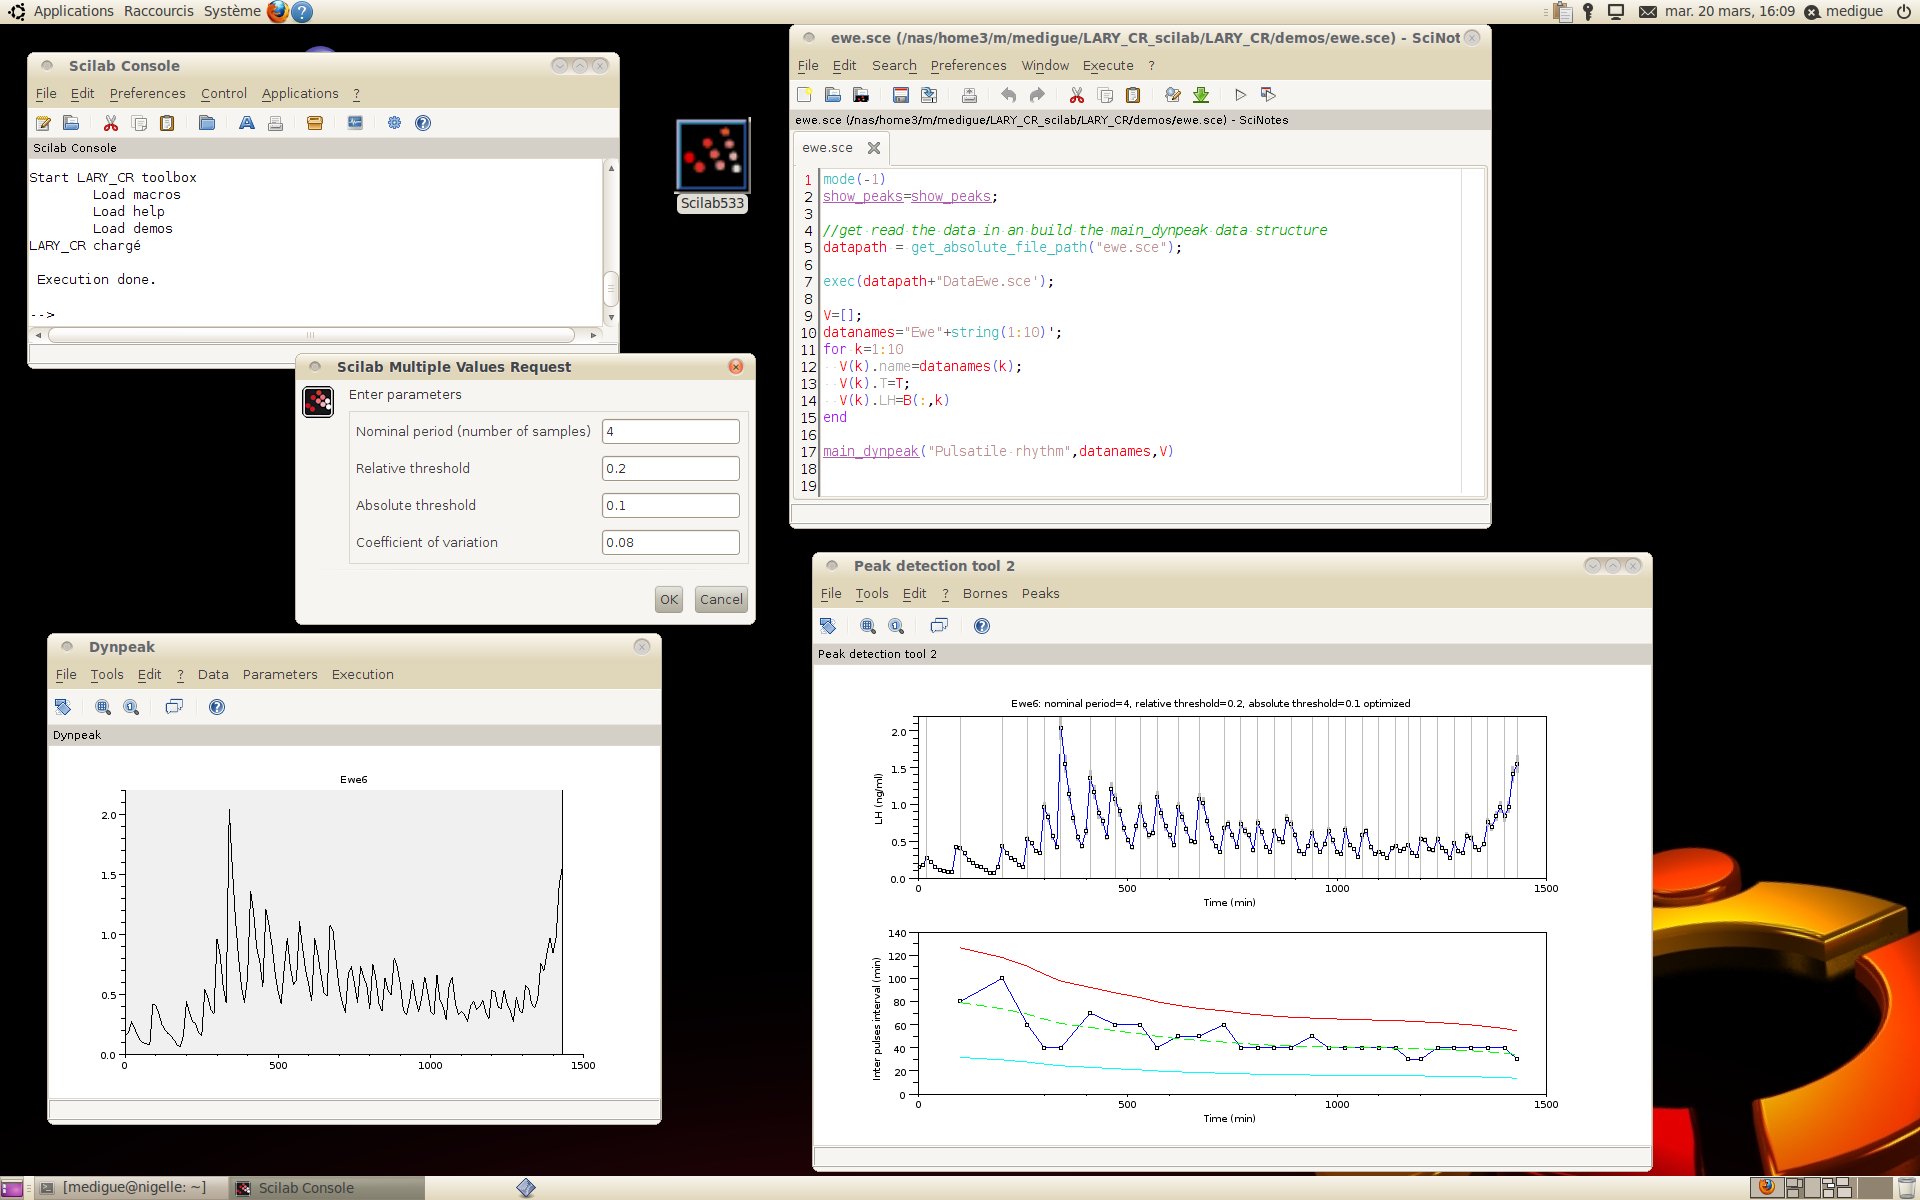
The following screens display the actual executing context in some cases of ewes LH series :
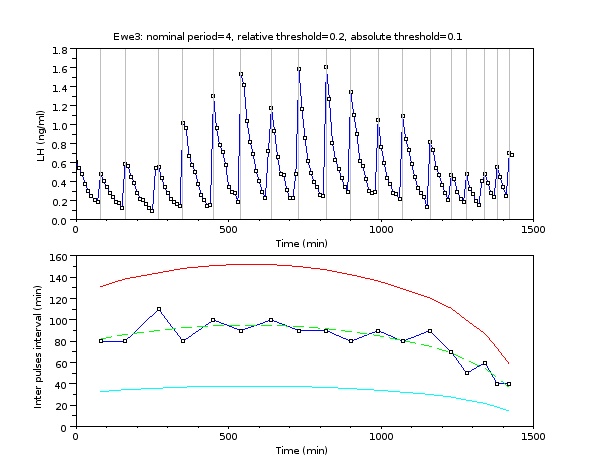
The 'Peak detection' figures present two panels. The top panels display the LH plasma time series and vertical lines correspond to pulse occurrences. The bottom panels display the resulting Inter Pulse Intervals (IPI) series, indexed by the pulse time. Each IPI value (marked by a blue circle) corresponds to the time elapsed between the current detected pulse and the previous one. The IPI series are displayed together with the three curves delimiting the tunnel: the dashed line represents the moving cubic function fitting the values of the IPI series, the solid lines represent the upper and lower bounds of the tunnel.
|
|
|
|
|
Screen 1 |
Screen 2 |
|
|
displays a case of progressive increasing pulsatile rhythm, without IPI outliers (figure ‘Peak detection tool 2, bottom panel). The main menu and the parameters window, set to default values, are shown. |
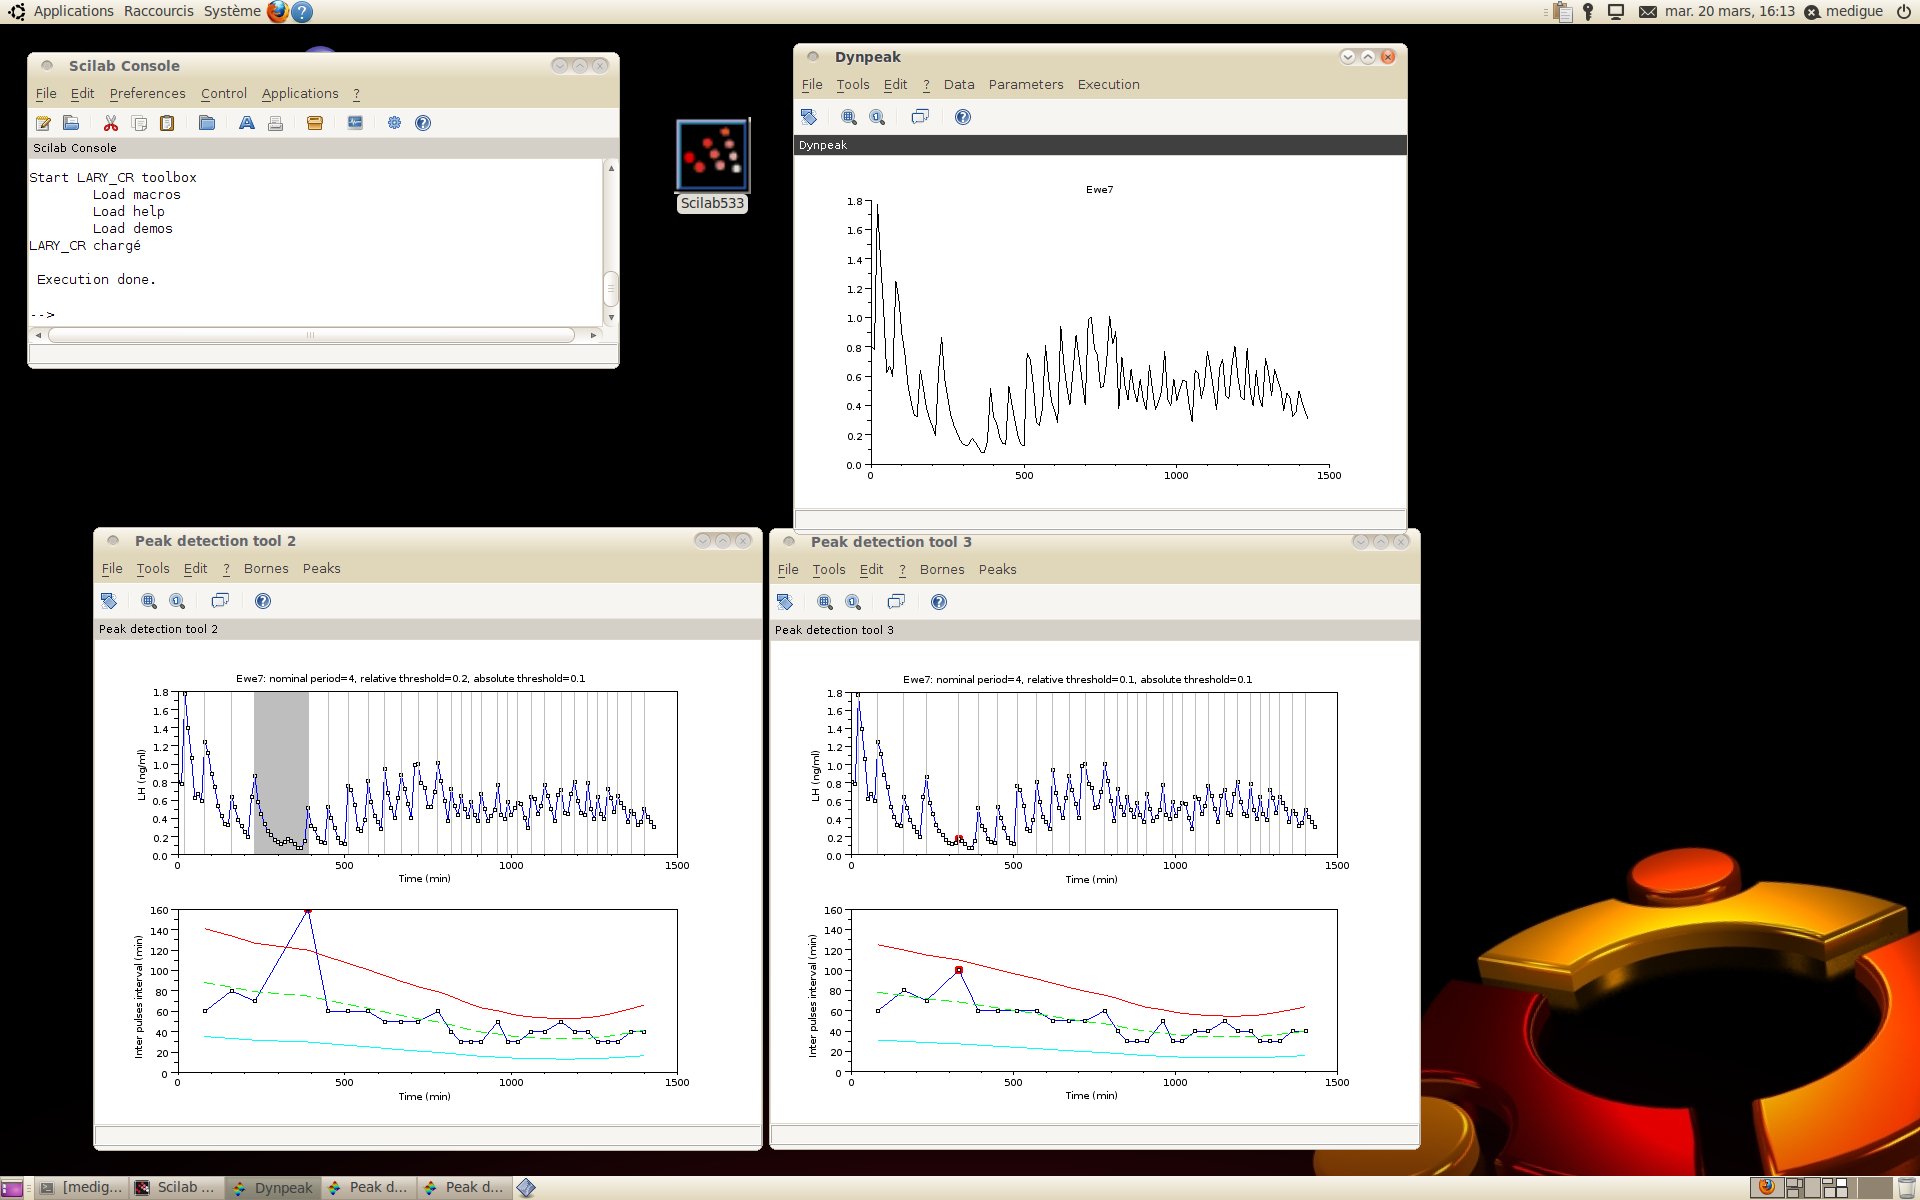
displays a case of apparent lack of detection, where the IPI outlier lies above the upper bound of the tunnel (figure ‘Peak detection tool 2’, red circle). Going back and forth between the IPI series and the LH time series allows us to favor the hypothesis of a genuine long IPI. Decreasing the relative magnitude threshold to 0.1 (default value = 0.2) allows the missed peak to be recovered (figure ‘Peak detection tool 3’). |
|
|
|
|
|
|
Screen 3 |
Screen 4 |
|
|
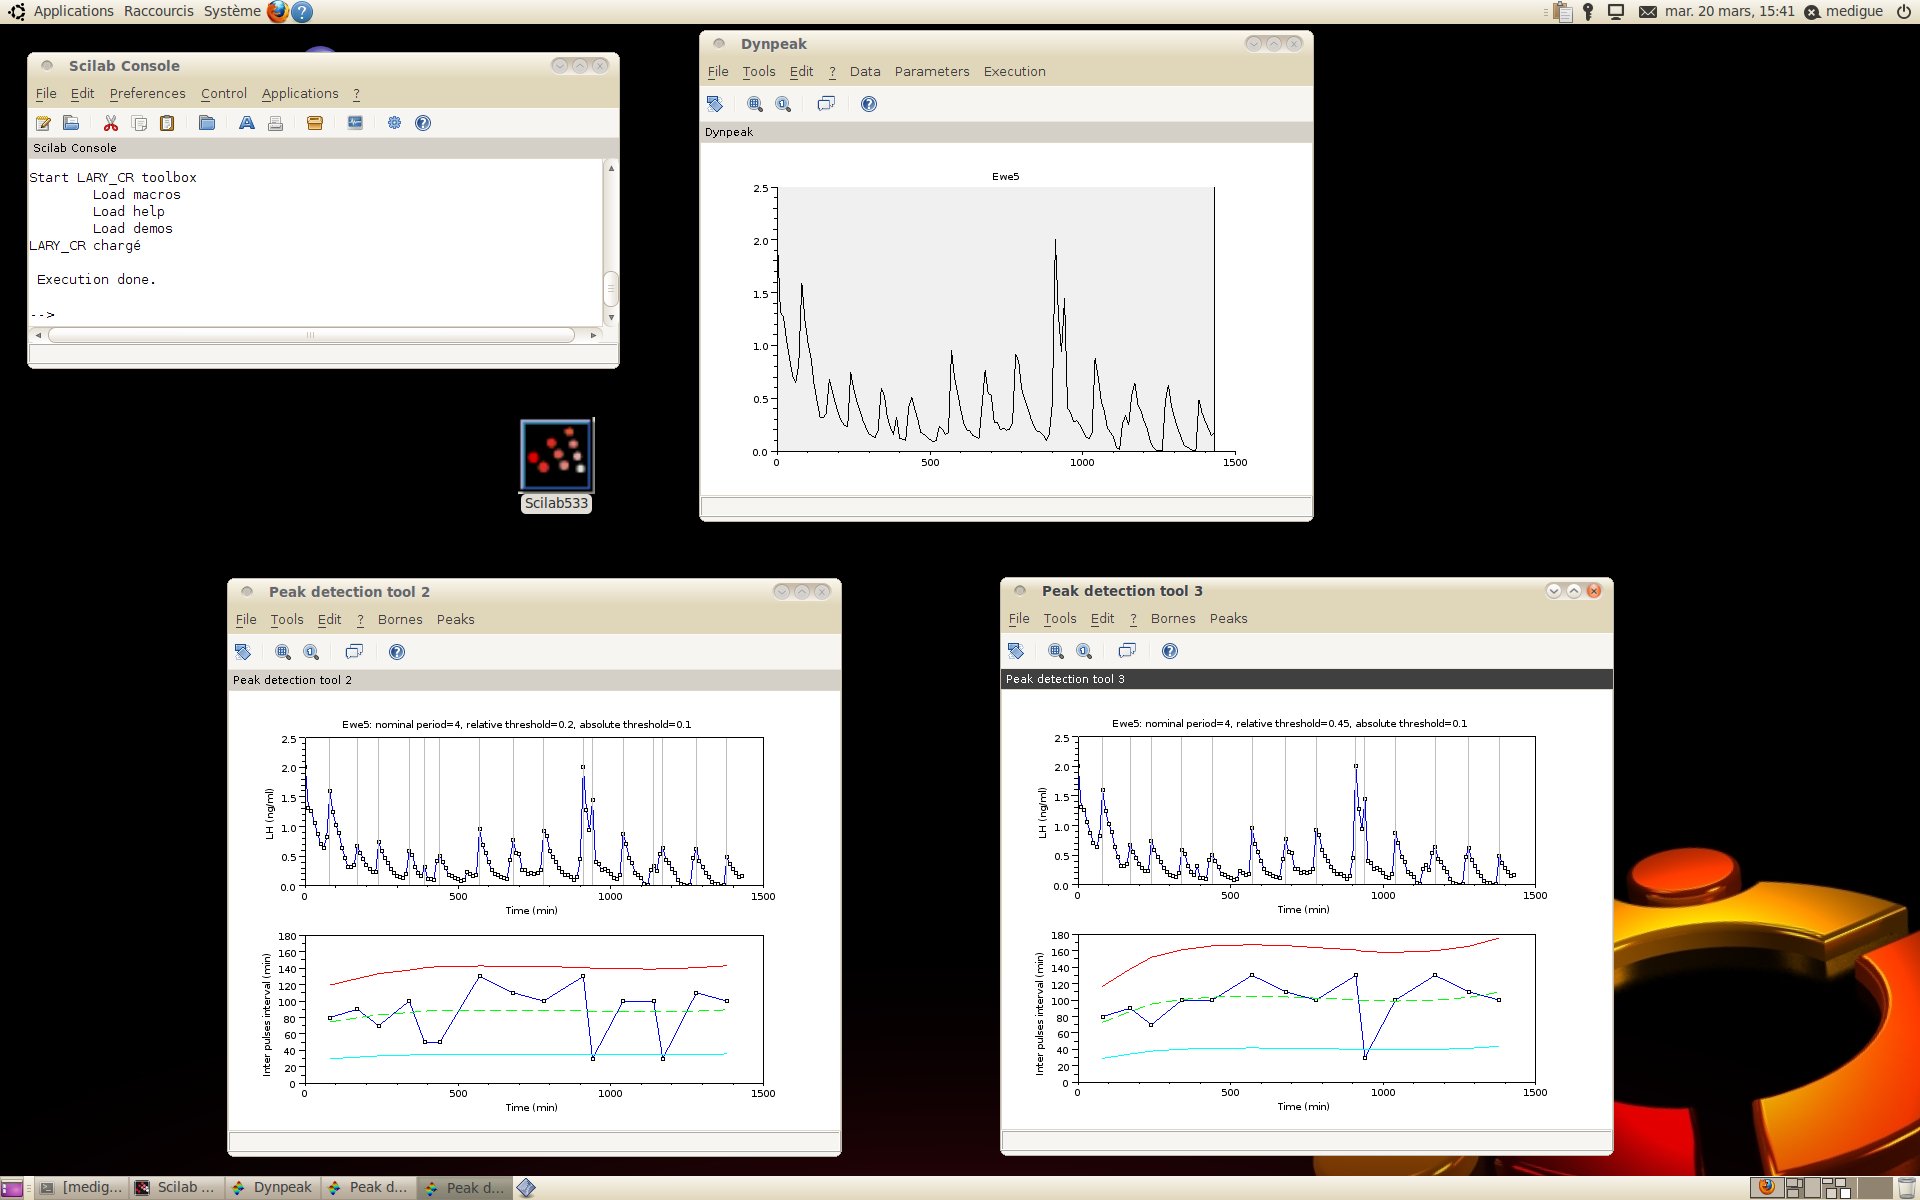
displays two cases of over-detection where the IPI outliers lie below the lower bound of the tunnel and two cases where the IPI’s are close enough to it to draw the user’s attention (figure ‘Peak detection tool 2’). Increasing the relative magnitude threshold to 0.45 (default value = 0.2) allows two of the three false peaks to be discarded (figure ‘Peak detection tool 3’). |
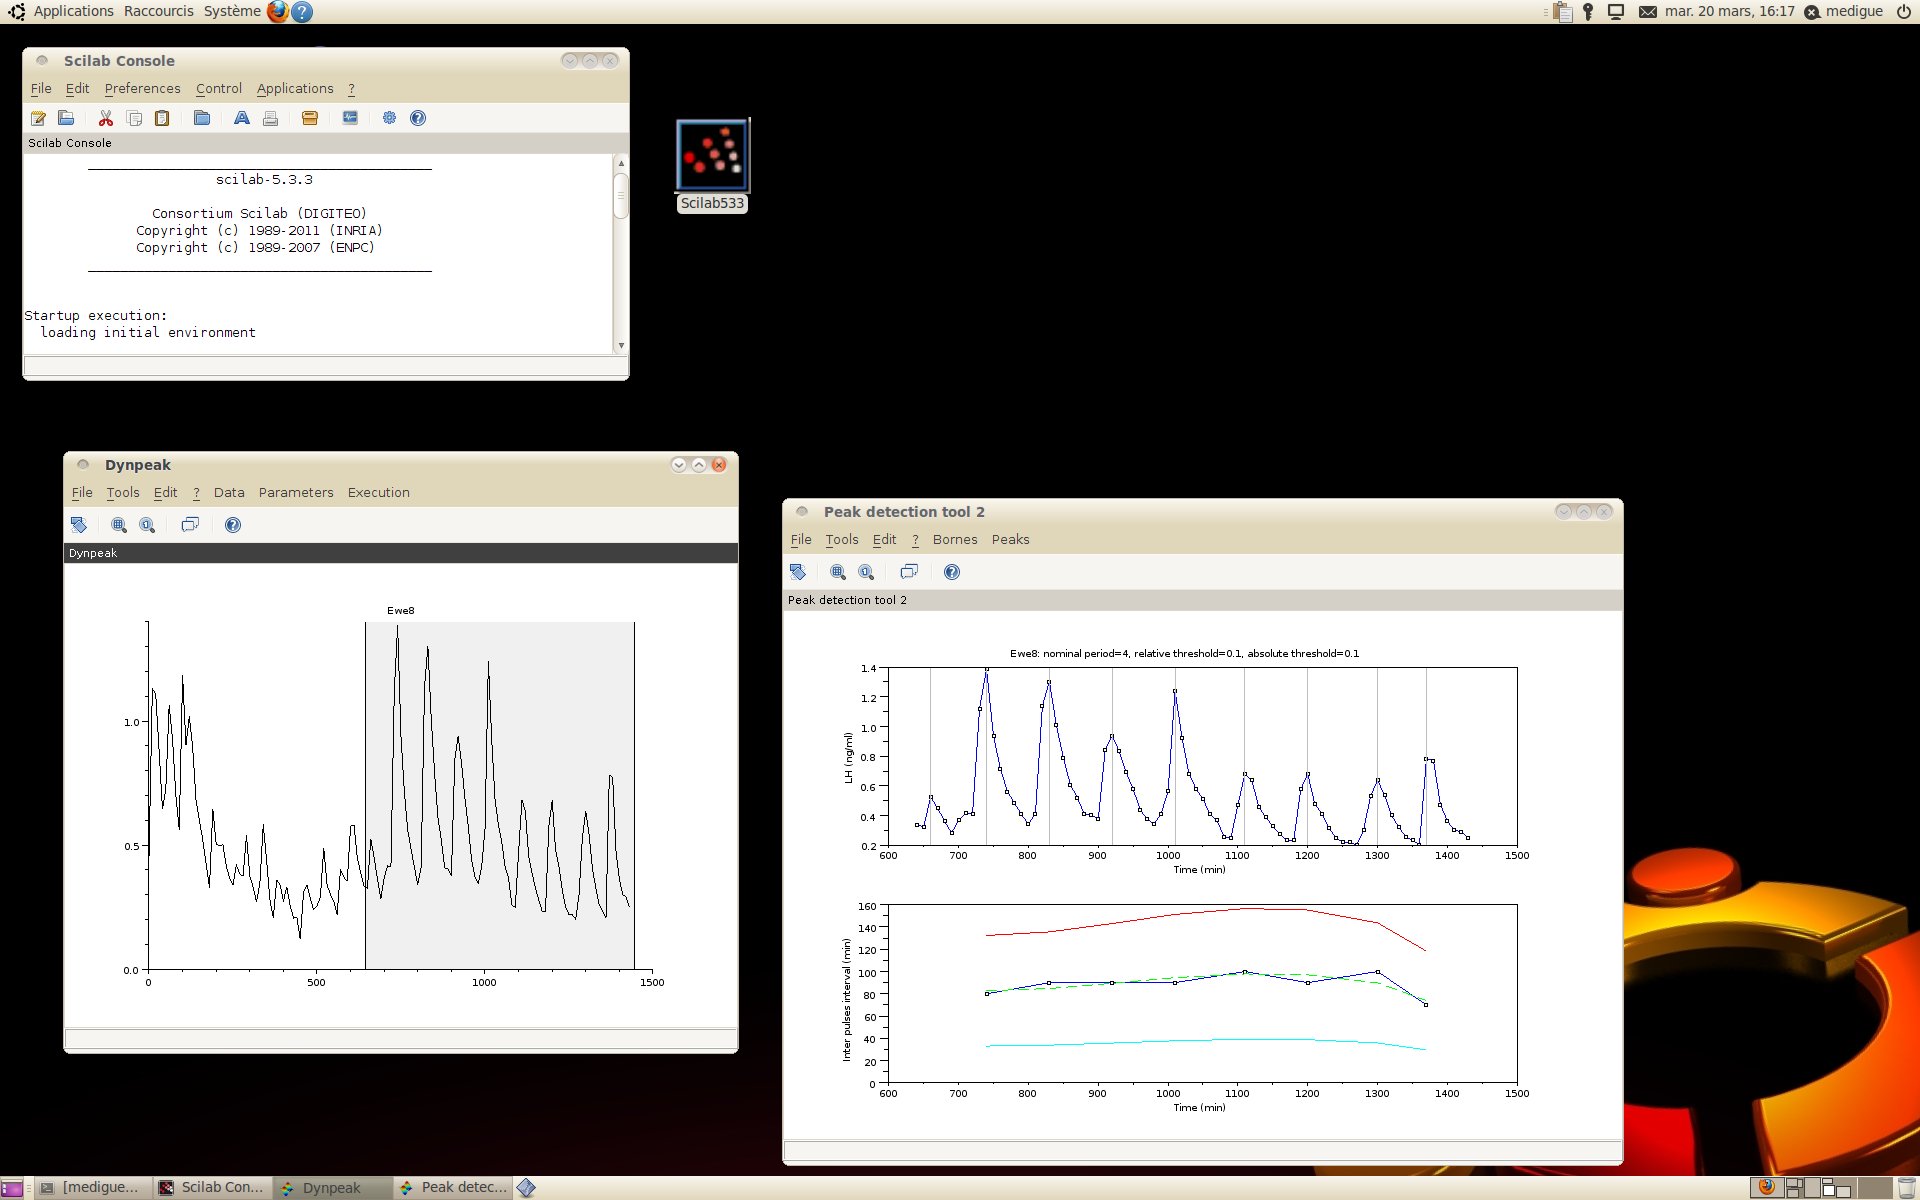
displays a case of pulses detection after selection of a part of the LH time series. The second period of the series alone, was treated. |