Next: 3.3 Two-dimensional stresses TRSTXX Up: 3 Visualization of solutions Prev: 4.1 Introduction Contents
![]()
![]()
![]()
![]()
![]()
![]()
![]()
![]()
Next: 3.3 Two-dimensional stresses TRSTXX
Up: 3 Visualization of solutions
Prev: 4.1 Introduction
Contents
Preprocessor TRMCXX is used to visualize meshes and the corresponding solutions. It enables the user to visualize:
In practice, using preprocessor TRMCXX, the user indicates to the module the different choices made from the possibilities offered.
The module computes the extrema corresponding to the mesh and solution automatically so that the corners of the box in which the plot will be displayed can be defined.
The menu of TRMACO (module called in this case) is shown below:
 ------------------------------------------------------------
 | 10 | PLOT TYPE                 |         MESH ONLY
 ------------------------------------------------------------
 | 11 | DEVICE NUMBER             |              1
 ------------------------------------------------------------
 | 12 | PLOT TITLE                |
 ------------------------------------------------------------
 | 20 | D.S. MAIL TO PLOT         |         carre.mail
 ------------------------------------------------------------
 | 20 | D.S. COOR TO PLOT         |         carre.coor
 ------------------------------------------------------------
 | 31 | QUESTIONS ABOUT ONE D.S.  |   NO
 ------------------------------------------------------------
 | 30 | PLOT SIZE                 |  AUTO
 ------------------------------------------------------------
 | 40 | CHARACTER TYPE            |  HARD
 ------------------------------------------------------------
 | 50 | ITEMS TO PLOT             |  TRIANGULATION
 ------------------------------------------------------------
 | 60 | LEGEND                    |  YES
 ------------------------------------------------------------
 | 70 | NUMBER                    |  NONE
 ------------------------------------------------------------
 | 80 | LINE TYPE (MESH)          |  SOLID
 ------------------------------------------------------------
A default value is proposed for each option. By default, only the mesh is visualized. To view the solution as well, key 10 must be selected. The above table lists the selections made automatically. Type 0 to obtain a plot.
A key (a number) and a status correspond to each item. To modify the status, it suffices to type the key and enter the values corresponding to the status desired (see the general introduction). The list of keys is given below:
  -- MESH
     NOTHING                 : 0
     TRIANGULATION           : 1
     GEOMETRIC BOUNDARY      : 2
     REFERENCED BOUNDARY     : 3
     SHRINK                  : 4  ?
The shrink operation consists of contracting, by a given ratio (0.8 by default, value
modified via key 23), each element with respect to its barycentre.
    NO NUMBER          : 0
    ELEMENT : 1 - POINT: 2 - NODE  : 3
    SUBDOMAIN          : 4
    REFERENCE (ALL)    : 5
    REFERENCE POINTS   : 6 - NODES : 7
    REFERENCE EDGES    : 8
    SOLID      : 1  --   DOTTED    : 2
    DASHED     : 3  --   MIXED     : 4 ?
Once a plot is displayed on the screen, a graphics menu appears, as for the other modules, which allows us to:
We now give some details regarding the choices possible as a function of the type of visualization selected:
This corresponds to the case described above (identical with respect to the possibilities offered by preprocessor TRNOXX for the two-dimensional case, to which the reader is referred).
Activate key 10 and choose option 1. It is then necessary to enter the name of the file containing D.S. B containing the solutions (displacements or velocities interpreted as displacements). The enlarged menu (additional keys followed by an asterisk) is given below:
 ------------------------------------------------------------
 | 10 | PLOT TYPE                 |         MESH AND DEFORMATION
 ------------------------------------------------------------
 | 11 | DEVICE NUMBER             |              1
 ------------------------------------------------------------
 | 12 | PLOT TITLE                |
 ------------------------------------------------------------
 | 20 | D.S. MAIL TO PLOT         |         carre.mail
 ------------------------------------------------------------
 | 20 | D.S. COOR TO PLOT         |         carre.coor
 ------------------------------------------------------------
 | 21 | S.D. B USED               |         carre.solu2
 ------------------------------------------------------------
 | 24 | LOAD CASE                 |              1
 ------------------------------------------------------------
 | 27 | ARRAY B4 SELECTED         |              1
 ------------------------------------------------------------
 | 22 | DEFORMATION RATIO         |            100.0000
 ------------------------------------------------------------
 | 31 | QUESTIONS ABOUT ONE D.S.  |   NO
 ------------------------------------------------------------
 | 30 | PLOT SIZE                 |  AUTO
 ------------------------------------------------------------
 | 40 | CHARACTER TYPE            |  HARD
 ------------------------------------------------------------
 | 50 | ITEMS TO PLOT             |  NO MESH
 ------------------------------------------------------------
 | 50 | ITEMS TO PLOT (DEFORM)    |  TRIANGULATION
 ------------------------------------------------------------
 | 60 | LEGEND                    |  YES
 ------------------------------------------------------------
 | 70 | NUMBER                    |  NONE
 ------------------------------------------------------------
 | 80 | LINE TYPE (MESH)          |  SOLID
 ------------------------------------------------------------
 | 80 | LINE TYPE (DEFORMED)      |  SOLID
 ------------------------------------------------------------
A default value is proposed for each option. The above table lists the selections made automatically when plotting the deformations. Type 0 to obtain the plot.
A key (a number) and a status correspond to each item. To modify the status, it suffices to type the key and enter the values corresponding to the status desired (see the general introduction). The list of keys is given below:
    SOLID      : 1  --   DOTTED    : 2
    DASHED     : 3  --   MIXED     : 4 ?
Once a plot is displayed on the screen, a graphics menu appears, as for the other modules, which allows us to execute operations (0), (1), (2), (3), (4), (5 or M), (6), (8) and (9) already described.
The plot was obtained by typing the following sequence:
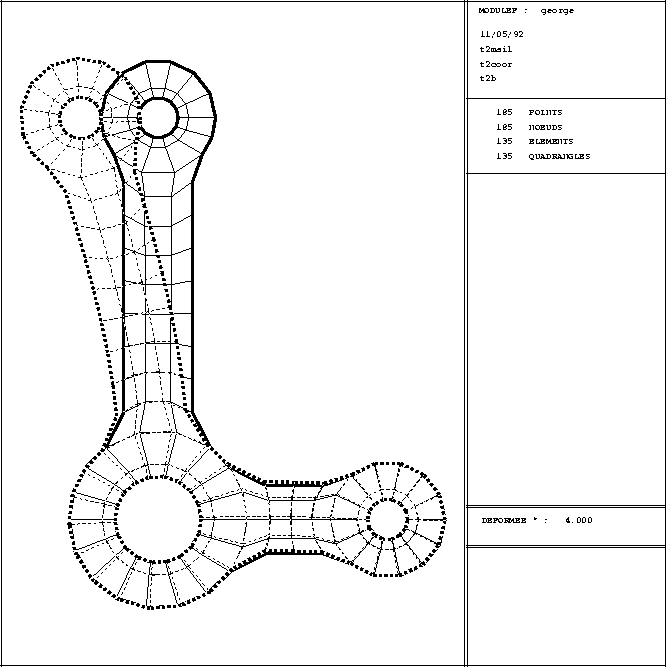
Figure 3.1: Example TRMCXX 2D: mesh and deformation
Activate key 10 and choose option 2. It is then necessary to enter the name of the file containing D.S. B containing the solutions. The enlarged menu (additional keys are indicated by an asterisk) is given below:
 -------------------------------------------------------------
 | 10 | PLOT TYPE                 |         MESH AND ISOVALUES
 -------------------------------------------------------------
 | 11 | DEVICE NUMBER             |              1
 -------------------------------------------------------------
 | 12 | PLOT TITLE                |
 -------------------------------------------------------------
 | 20 | D.S. MAIL TO PLOT         |         carre.mail
 -------------------------------------------------------------
 | 20 | D.S. COOR TO PLOT         |         carre.coor
 -------------------------------------------------------------
 | 21 | S.D. B USED               |         carre.solu
 -------------------------------------------------------------
 | 24 | LOAD CASE                 |              1
 -------------------------------------------------------------
 | 27 | ARRAY B4 SELECTED         |              1
 -------------------------------------------------------------
 | 32 | MNEMONIC IN USE           |  VN
 -------------------------------------------------------------
 | 25 | NUMBER OF ISOVALUES       |      20
 -------------------------------------------------------------
 | 26 | CHOICE FOR ISOVALUES      |   MIN < ** < MAX
 -------------------------------------------------------------
 | 72 | ISOVALUES PLOT            |   IN COLOUR
 -------------------------------------------------------------
 | 45 | COLOR SPECTRUM            |   STANDARD : RED -> BLUE
 -------------------------------------------------------------
 | 46 | SPECTRUM DIRECTION        |   DIRECT
 -------------------------------------------------------------
 | 34 | COLOR-VALUE IMPOSED       |   NO
 -------------------------------------------------------------
 | 71 | ISOVALUES ARE POINTED     |   NO
 -------------------------------------------------------------
 | 31 | QUESTIONS ABOUT A D.S.    |   NO
 -------------------------------------------------------------
 | 30 | PLOT SIZE                 |  AUTO
 -------------------------------------------------------------
 | 40 | CHARACTER TYPE            |  HARD
 -------------------------------------------------------------
 | 50 | ITEMS TO PLOT             |  TRIANGULATION
 -------------------------------------------------------------
 | 60 | LEGEND                    |  YES
 -------------------------------------------------------------
 | 70 | NUMBER                    |  NONE
 -------------------------------------------------------------
 | 80 | LINE TYPE (MESH)          |  SOLID
 -------------------------------------------------------------
 | 80 | LINE TYPE (ISOVALUES)     |  SOLID
 -------------------------------------------------------------
A default value is proposed for each option. The above table lists the selections made automatically when plotting the isovalues. Type 0 to obtain the plot.
A key (a number)and a status correspond to each item. To modify the status, it suffices to type the key and enter the values corresponding to the status desired (see the general introduction). The list of keys is given below:
   REPRESENTATION CHOICE:
     -1 : FIXED COLOUR LINE
      0 : COLOUR LINE
      1 : SHADED
   SPECTRUM ON 8 PLANE MONITOR:
   STANDARD  : RED TO BLUE           : 1
   RAINBOW   : RED TO MAGENTA        : 2
   THERMAL   : BLACK-RED-YELLOW-BLACK: 3
   MAXIMUM   : BLACK-COLOUR-WHITE    : 4
   BLACK AND WHITE                   : 5
    SOLID      : 1  --   DOTTED    : 2
    DASHED     : 3  --   MIXED     : 4 ?
and for the isovalues (for an unmarked line plot) with the same choice.
Once a plot is displayed on the screen, a graphics menu appears, as for the other modules, which allows us to:
The only new feature is the item to obtain the value of an isovalue. There are several ways of performing this interrogation, described below:
The plots were obtained by typing the following sequences:
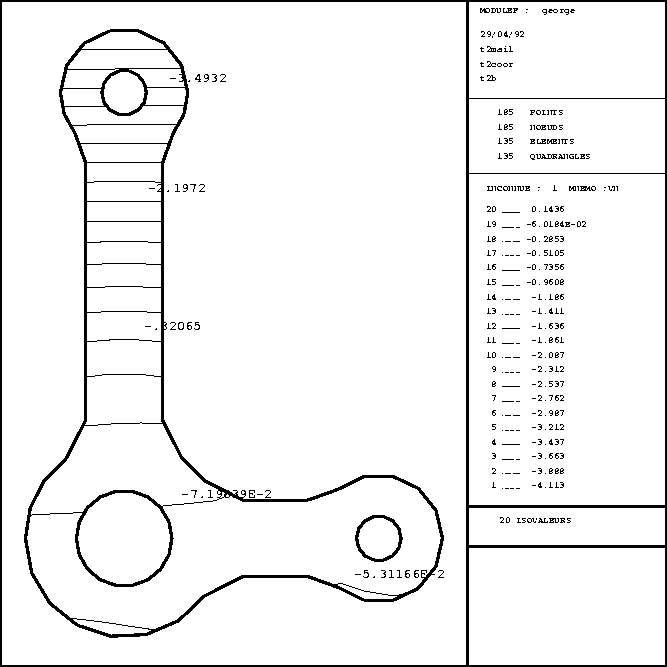
Figure 3.2: Example TRMCXX 2D: Mesh and isovalues
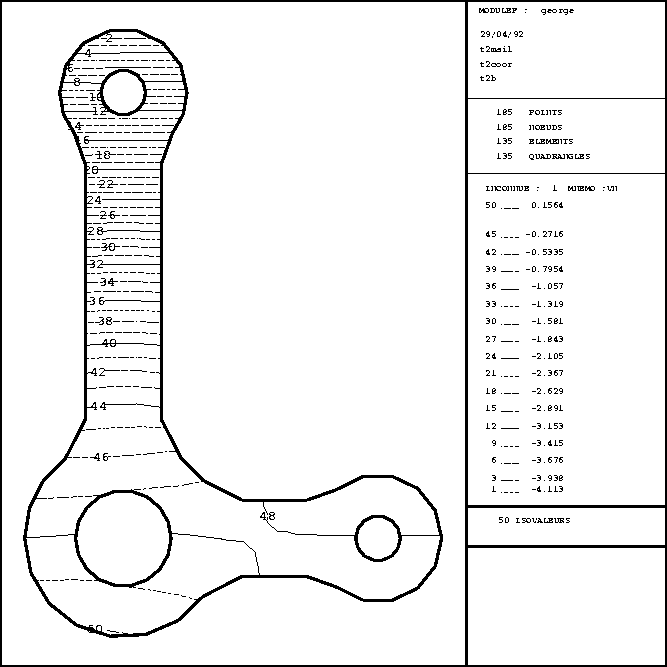
Figure 3.3: Example TRMCXX 2D: Isovalues indicated
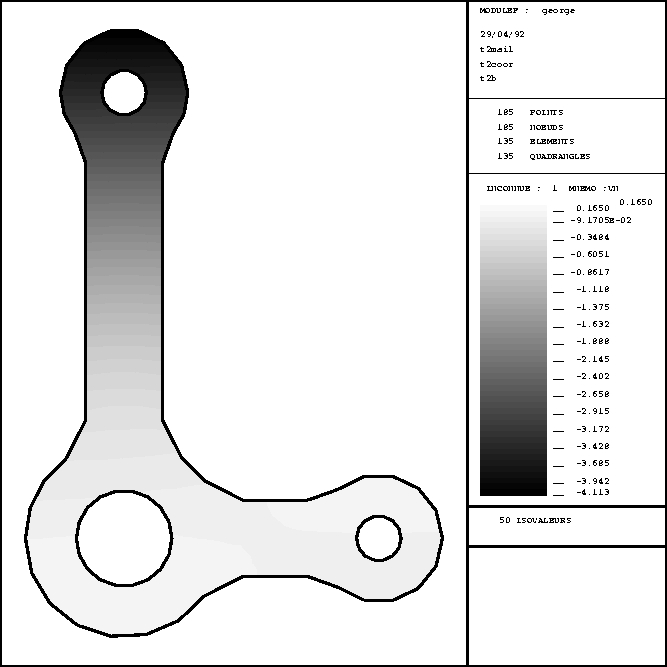
Figure 3.4: Example TRMCXX 2D: Isovalues with shading
Activate key 10 and choose option 3. It is then necessary to enter the name of the file containing the D.S. B containing the velocities. The enlarged menu is shown below:
 ------------------------------------------------------------
 | 10 | PLOT TYPE                 |         MESH AND VELOCITY
 ------------------------------------------------------------
 | 11 | DEVICE NUMBER             |              1
 ------------------------------------------------------------
 | 12 | PLOT TITLE                |
 ------------------------------------------------------------
 | 20 | D.S. MAIL TO PLOT         |         carre.mail
 ------------------------------------------------------------
 | 20 | D.S. COOR TO PLOT         |         carre.coor
 ------------------------------------------------------------
 | 21 | S.D. B USED               |         carre.solu2
 ------------------------------------------------------------
 | 24 | LOAD CASE                 |              1
 ------------------------------------------------------------
 | 27 | ARRAY B4 SELECTED         |              1
 ------------------------------------------------------------
 | 29 | BIGEST ARROW IN CM.       |            2.000000
 ------------------------------------------------------------
 | 28 | ARROW ENDS                |             -1
 ------------------------------------------------------------
 | 31 | QUESTIONS ABOUT A D.S.    |   NO
 ------------------------------------------------------------
 | 30 | PLOT SIZE                 |  AUTO
 ------------------------------------------------------------
 | 40 | CHARACTER TYPE            |  HARD
 ------------------------------------------------------------
 | 50 | ITEMS TO PLOT             |  TRIANGULATION
 ------------------------------------------------------------
 | 60 | LEGEND                    |  YES
 ------------------------------------------------------------
 | 70 | NUMBER                    |  NONE
 ------------------------------------------------------------
 | 80 | LINE TYPE (MESH)          |  SOLID
 ------------------------------------------------------------
 | 80 | LINE TYPE (ARRAYS)        |  SOLID
 ------------------------------------------------------------
A default value is proposed for each option. The above table lists the selections made automatically when plotting the velocities. Type 0 to obtain the plot.
A key (a number) and a status corresponds to each item. To modify the status, it suffices to type the key and enter the values corresponding to the status desired (see the general introduction). The list of keys is given below:
   EXTREMITY OPEN , NORMALISED : -1
   EXTREMITY CLOSED , NORMALISED  :  1
   EXTREMITY OPEN , FIXED      : -2
   EXTREMITY CLOSED , FIXED       :  2
The arrowhead is open (2 lines) or closed (a triangle), and its "length" is calculated as a function of the size of the arrow (which is related to the velocity modulus) or fixed (for all the arrows) to a value specified by the user.
    SOLID      : 1  --   DOTTED    : 2
    DASHED     : 3  --   MIXED     : 4 ?
Once a plot is displayed on the screen, a graphics menu appears, as for the other modules, which allows us to execute operations (0), (1), (2), (3), (4), (5 or M), (6), (7 X A Z), (8) and (9) already described.
The only new feature is the item to obtain the value of a velocity. There are several ways of performing this interrogation, described below:
The plots were obtained by typing the following sequences:
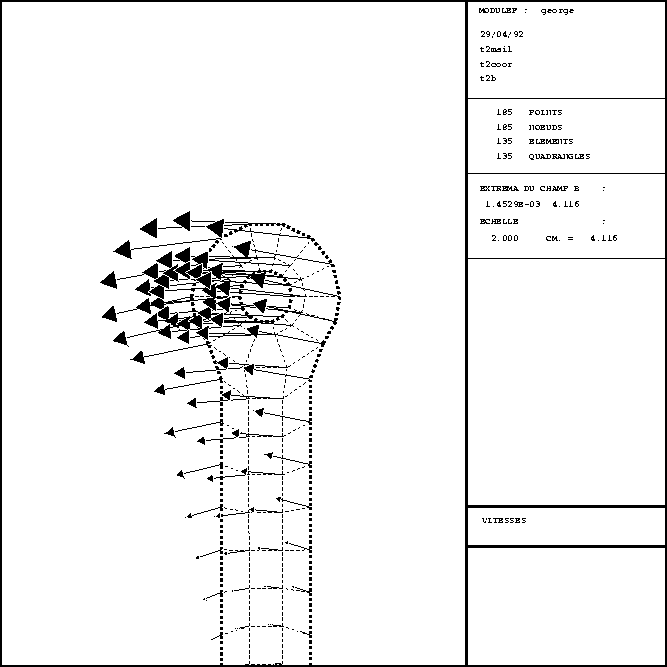
Figure 3.5: Example TRMCXX 2D: mesh (zoom) and velocities
Activate key 10 and choose option 4. It is then necessary to enter the name of the file containing the D.S. B containing the solution. The enlarged menu is shown below:
 ------------------------------------------------------------
 | 10 | PLOT TYPE                 |  MESH AND CUT OF A D.S. B
 ------------------------------------------------------------
 | 11 | DEVICE NUMBER             |              1
 ------------------------------------------------------------
 | 12 | PLOT TITLE                |
 ------------------------------------------------------------
 | 20 | D.S. MAIL TO PLOT         |         carre.mail
 ------------------------------------------------------------
 | 20 | D.S. COOR TO PLOT         |         carre.coor
 ------------------------------------------------------------
 | 21 | S.D. B USED               |         carre.solu
 ------------------------------------------------------------
 | 24 | LOAD CASE                 |              1
 ------------------------------------------------------------
 | 27 | ARRAY B4 SELECTED         |              1
 ------------------------------------------------------------
 | 37 | CUT SELECTION             |         AUTO
 ------------------------------------------------------------
 | 38 | UNKNOWN CHOSEN            |          1
 ------------------------------------------------------------
 | 38 | MNEMO CHOSEN              |         VN
 ------------------------------------------------------------
 | 39 | TYPE OF FUNCTION(S)       |         VC
 ------------------------------------------------------------
 | 31 | QUESTIONS ABOUT A D.S.    |   NO
 ------------------------------------------------------------
 | 30 | PLOT SIZE                 |  AUTO
 ------------------------------------------------------------
 | 40 | CHARACTER TYPE            |  HARD
 ------------------------------------------------------------
 | 50 | ITEMS TO PLOT             |  TRIANGULATION
 ------------------------------------------------------------
 | 60 | LEGEND                    |  YES
 ------------------------------------------------------------
 | 70 | NUMBER                    |  NONE
 ------------------------------------------------------------
 | 80 | LINE TYPE (MESH)          |  SOLID
 ------------------------------------------------------------
A default value is proposed for each option. The above table lists the selections made automatically when plotting the cuts. Type 0 to obtain the plot of the mesh on which we can define a cut via item (7) of the graphics menu or via key 37.
A key (a number) and a status corresponds to each item. To modify the status, it suffices to type the key and enter the values corresponding to the status desired (see the general introduction). The list of keys is given below:
 1 -- FIELD OF VALUES      : VC
 2 -- DERIVATIVE IN X      : DX
 3 -- DERIVATIVE IN Y      : DY
 4 -- GRADIENT MODULUS     : GR
 5 -- ALPHA * DX           : ADX
 6 -- ALPHA * DY           : ADY
 7 -- ALPHA * GRADIENT     : AGR
The user enters the number of functions to be considered, and for each its type (between 1 (default choice) and 7 (
 must be input if the choice is 5, 6 or 7)). As many curves will be plotted
as functions input.
must be input if the choice is 5, 6 or 7)). As many curves will be plotted
as functions input.
    SOLID      : 1  --   DOTTED    : 2
    DASHED     : 3  --   MIXED     : 4 ?
Once a plot (mesh only) is displayed on the screen, a graphics menu appears, as for the other modules, which allows us to execute operations (0), (1), (2), (3), (4), (5 or M), (6), (8) and (9) already described. Option (7) is used to define the cut line:
A question then appears on the screen:
VOULEZ VOUS PRECISER LES AXES (OUI-NON)
A negative response results in a automatic plot of the cut.
A positive response results in the following sub-menu:
 ------------------------------------------------------------
 | 22 | ECHELLE EN X              |   LINEAIRE
 ------------------------------------------------------------
 | 22 | ECHELLE EN Y              |   LINEAIRE
 ------------------------------------------------------------
 | 61 | LEGENDE SUR LES AXES      |   NON
 ------------------------------------------------------------
 | 62 | DEFINITION DES AXES       |   AUTO
 ------------------------------------------------------------
 | 63 | COURBE(S) AVEC LEGENDE    |   NON
 ------------------------------------------------------------
This menu is analogous to that of TRACXX which enables the user to define the axis of the cut (it corresponds therefore to plotting a curve, which is explained in detail in TRACXX).
Once the plot of the cut has been obtained, the following graphics menu appears:
The plot was obtained by typing the following sequence:
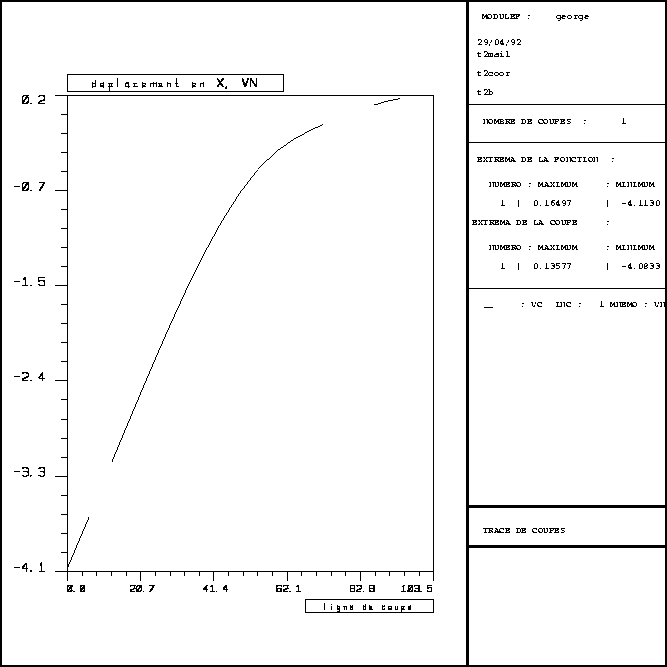
Figure 3.6: Example TRMCXX 2D: cut
This option enables the user to visualize the flux for mixed finite elements only. The flux is represented by arrows, as in the case of velocities, and we can consequently consult the operating instructions corresponding to plotting velocities. The only difference is that of key 56 in the main menu.
 ------------------------------------------------------------
 | 56 | VISUALISATION OF FLUX     |          EVERYWHERE
 ------------------------------------------------------------
This choice (by default) can be modified by activating key 56:
    ON ALL THE REFERENCES      : 0
    EVERYWHERE                 : 1
    ON SOME REFERENCES         : 2
Case 2 consists of specifying only those reference numbers which we desire.
When plotting the isovalues of a solution it is necessary to define exactly what we want to plot. The finite elements used (described in D.S. MAIL) can be more, or less, rich (as a function of the degree of interpolation chosen).
The plot program is purely P1 and applies to the case of a triangular type element. Using the solution values at the three vertices of the triangle, the isovalues present in the triangle are calculated.
Consequently, each finite element must be decomposed into the most judicious set of triangles such that the quality of the interpolation is preserved: it does not correspond to making beautiful plots but plots conforming to known information. The decomposition must thus satisfy this concern. It corresponds thus to interpreting each element in terms of P1 triangles.
The choices made for the usual element are given below:
Only certain elements are actually known and thus considered by the plot module. If an element is not known, the module will stop and indicate that it does not know this type of element. The user must then add it by decomposing it in a consistent manner with the corresponding interpolation.
The decomposition is the object of subroutine RANGPQ in library UTIL. This subroutine has the following form:
      SUBROUTINE RANGPQ(NOM1,NOM2,NCGE,NNO,NONO,NPO,NOPOI,COORP,
     +                  SOLU,XX,YY,SOL,NTRIP1)
C  +++++++++++++++++++++++++++++++++++++++++++++++++++++++++++++++++++
C  AIM : DECOMPOSE THE ELEMENT INTO P1 TRIANGLES ONLY
C  ---
C  +++++++++++++++++++++++++++++++++++++++++++++++++++++++++++++++++++
C  INPUT PARAMETERS :
C  ------------------
C  NOM1, NOM2 : ELEMENT NAMES
C  NCGE,NNO,NONO(*),NPO,NOPOI(*) : USUAL NOTATION
C  COORP   : POINT COORDINATES
C  SOLU    : SOLUTION ARRAY = B4(NDSMT,NDT,1:NOE)
C            WITH NDSMT : RIGHT-HAND-SIDE CONSIDERED ( BETWEEN 1 AND NDSM )
C                 NDT   : THE D.O.F. CONSIDERED ( BETWEEN 1 AND ND )
C                 B4    : ARRAY B4 CONSIDERED
C            REMARK     : SUBROUTINE CHARB4 CREATES SOLU FROM THE GLOBAL B4
C  OUTPUT PARAMETERS :
C  -------------------
C  XX(*),YY(*) : COORDINATES OF POINTS P1
C  SOL     : CORRESPONDING SOLUTIONS
C  NTRIP1  : NUMBER OF P1 ELEMENTS IN THE DECOMPOSITION OF THE ELEMENT
C  +++++++++++++++++++++++++++++++++++++++++++++++++++++++++++++++++++
C
C  SUBROUTINE TO BE COMPLETED FOR ALL NEW ELEMENTS INTERPRETED INTO P1.
C
C  +++++++++++++++++++++++++++++++++++++++++++++++++++++++++++++++++++
C  PROGRAMMEUR  : PL GEORGE  INRIA  1987
C  ....................................................................
      DIMENSION NONO(*),NOPOI(*),COORP(2,*),SOLU(*),XX(*),YY(*),
     +          SOL(*),SOLP1(3),SOLP2(6),SOLQ1(4),SOLQ2(9),INDIC(4),
     +          SOLQ5(5)
      CHARACTER*4 NOM1,NOM2
  200 FORMAT(' %% ERREUR RANGPQ : ELEMENT ',A4,A4,' NON CONNU'///
     +       ' VOIR LE SP RANGPQ ET AJOUTER CET ELEMENT'///)
C
      IMPRIM = IINFO('I')
C     -------------------------------------------------------
C     ------------         THE TRIANGLES         ------------
C     -------------------------------------------------------
      IF ( NOM1 .EQ. 'TRIA'  ) THEN
C        -------------   TRIANGLE :  NOM COMMENCANT PAR TRIA
         IF( NOM2 .EQ. '2P1D' ) THEN
C        ------   TRIA 2P1D   ------
             NTRIP1 = 1
             NUMER  = 0
             DO 301 J=1,NNO
                SOLP1(J) = SOLU(NONO(J))
                INDIC(J) = J
  301        CONTINUE
             CALL RANGP1(NUMER,COORP,INDIC,SOLP1,XX,YY,SOL)
         ELSE IF( NOM2 .EQ. 'AP1D' ) THEN
C        ------   TRIA AP1D   ------
             NTRIP1 = 1
             NUMER  = 0
             DO 339 J=1,NNO
                SOLP1(J) = SOLU(NONO(J))
                INDIC(J) = J
  339        CONTINUE
             CALL RANGP1(NUMER,COORP,INDIC,SOLP1,XX,YY,SOL)
         ELSE .....
              .....
              .....               elements unknown
         ELSE
             WRITE (IMPRIM,200) NOM1,NOM2
             CALL TILT                           elements unknown
         END IF
C     -------------------------------------------------------
C     ------------         THE QUADRILATERALS    ------------
C     -------------------------------------------------------
      ELSE IF ( NOM1 .EQ. 'QUAD' ) THEN
         IF ( NOM2 .EQ. '2Q1D' ) THEN
C        ------   QUAD 2Q1D   ------
             NTRIP1 = 4
             DO 406 J=1,NNO
               SOLQ1(J) = SOLU(NONO(J))
               INDIC(J) = J
  406        CONTINUE
             NUMER = 0
             CALL RANGQ1(NUMER,COORP,INDIC,SOLQ1,XX,YY,SOL)
         ELSE .....
              .....
              .....               elements unknown
         ELSE
             WRITE (IMPRIM,200) NOM1,NOM2
             CALL TILT
         END IF                               elements unknown
      ELSE
         WRITE (IMPRIM,200) NOM1,NOM2
         CALL TILT                      elements unknown
      END IF
      END
Subroutine RANGPQ uses a certain number of element subroutines (RANGP1, RANGP2, RANGQ1, RANGQ2 ...). To add a finite element corresponds to adding the appropriate branch and using the appropriate element subroutine or writing a new one (each one very simple). To govern the computation, we have at our disposal, NOM1 and NOM2, the two parts of the element name, its geometric code, its number of points and nodes and the arrays containing its points and nodes (it seems that with this information we are able to recognize all the elements without ambiguity).
Decomposition example using the subroutine names:
| RANGPQ | ||
| if | TRIA 2P1D : | RANGP1 1 P1  1 P1 1 P1 |
| TRIA AP1D : | the same | |
| if | TRIA 2P2D : | RANGP2 1 P2 4 P1 |
| - calculate the middle coordinates | ||
| - and store RANGP1 the solution | ||
| if | TRIA 2P2C : | RANGP2 1 P 2 4 P1 |
| - store RANGP1 the solution | ||
| TRIA AP2C : | the same | |
| if | QUAD 2Q1D : | RANGQ1 1 Q1 4 P1 |
| - calculate the barycentre and the solution | ||
| - and store RANGP1 this solution | ||
| QUAD AQ1C : | the same | |
| if | QUAD 2Q2D : | RANGQ2 1 Q2 16 P1 |
| - calculate the middle coordinates | ||
| - calculate the barycentre and the solution | ||
| and store RANGQ1 (RANGP1) this solution | ||
| if | QUAD 2Q2C : | RANGQ2 1 Q2 16 P1 |
| - calculate the barycentre and the solution | ||
| - and store RANGQ1 (RANGP1) this solution | ||
| QUAD AQ2C : | the same | |
| ...... etc |